Below is a graph generated for me by Fred Newman of the View Camera store, using the BTZS Plotter software. It shows recommended development times for different treatments according to the Zone System. (N is the development we would give for subjects of normal contrast range.)
The graph is specifically for Ilford HP5+, tray-developed by me in my darkroom in D-23 1:1 at 70 deg F.
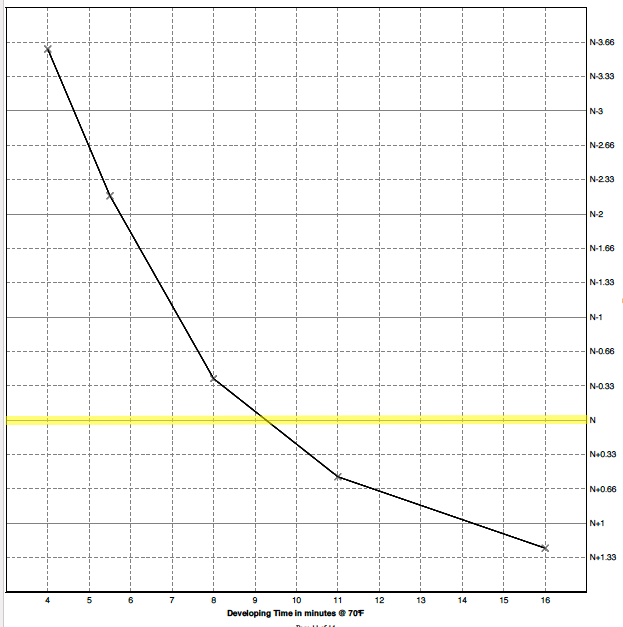
You can see that the recommended time for N development is around 9 minutes and 20 seconds. For N-1, it's just over 7 minutes... etc.
This graph was made by Fred exposing sheets of film under an enlarger with a step-wedge, then me doing the development, then Fred measuring the results with a densitometer. Thus, it is independent of any camera, shutter or lens. Because I developed the film, it was custom tailored to my method of agitation, my water, my thermometer, etc.
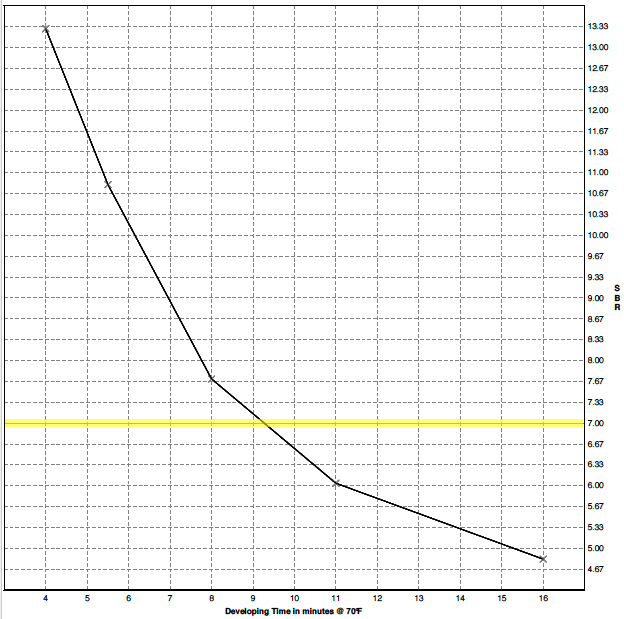
I shared the Zone System graph here since you know that system, but the Plotter software delivers many graphs, such as how effective film speed changes with changes in development time, contrast, SBR, etc.
BTZS generates a lot of charts with great precision, but the results are not essentially different from what we get by following widely published time/temperature charts. If the differences were substantial, we'd have to wonder why.


 Reply With Quote
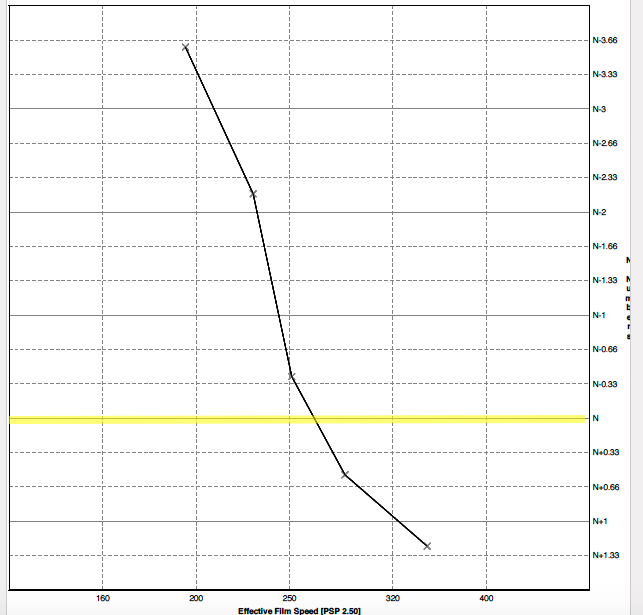


Bookmarks