
You can also make your own curves and profiles using QTR and Curve Calculator III. Good densitometers aren't too expensive on eBay. I happen to have an i1 Pro 2, though and may use that.


You can also make your own curves and profiles using QTR and Curve Calculator III. Good densitometers aren't too expensive on eBay. I happen to have an i1 Pro 2, though and may use that.
Is Curve Calcluator III designed strictly for making digital negatives for alt-process printing, or does it also work for direct printing ?
I notice that the author recommends the use of a 31-step target: "A 31-step provides increased accuracy in calibration over the 21-step tablet.". Is that the basis for calibration ? It's better than 21, but using 256 steps seems more promising to me on the face of it.
At IJM we calibrate at 256 steps but in 64bit computational space. It's complicated but the result is the result. Everything else out there is simply sub-par and noticeably so when you visually look at one print against another.
That said, we have recently optimized Roy's QTR-Linearize-Quad workflow to allow (DIY) iterative profiling that enables near perfect (smooth) linearization with an iterative method. These targets and optimization tools will be available soon. It will be available to Piezography customers.
Both PiezoDN digital negatives and print positives can be calibrated like this with Piezo inks.
regards,
Walker
R&D InkjetMall
------------------
Walker Blackwell
I know this is really late, but I wanted to chime in with a little more detail about why I thought Ken was getting the most he could with the tools at hand.
1. SpyderPrint is not accurate or consistent enough to do the kind of calculations needed to arrive at perfectly smooth k6-k7 profiles. The i1 Pro or one of the automated chart readers do better with this because they sample at 100-200 times a second depending on the model and software running it.
2. Many people follow the standard QTR workflow for setting the ink limits at a default limit for each ink. In my experience this does not give as even coverage as determining the density for each ink to evenly partition the gray scale. This is to prevent the inks from ramping up and down too quickly or using too many inks bunched up in the shadows and not having as much coverage throughout the highlights and midtones.
3. People are not accurately setting the cross over points—that is either because of guessing, following some bad advice, too aggressive rounding, or inaccuracies with the measurement device. Ken was doing the best he could here averaging several readings for interpolating the cross over points but I think there were still other problems that were out of his control. The increased gray overlap Sandy referenced can prevent or hide some of those errors but...
4. The biggest hurdle is not the tools or the calculations, but the way the QTR curve creation program changes the "shape" of the ink curve as new inks are introduced and the way they overlap. This is where the Piezography curves are really doing their magic. The bezier path that creates the long gentle slops and trailing edges in the Piezography curves hide any irregularities better than the QTR generated curves. I was experimenting with making bezier curves and then linearizing them with my own linearizer for Ken, but things got too busy and ended up going with the Cone inks and new carts (which are better anyway).
5. "everything else out there is sub par" for MOST people doing stuff with the standard QTR tools or hand mixed inks, yes.
Personal Site http://www.richardboutwell.com
Black and White Aesthetics, Editing, and Printing http://www.BWMastery.com

I am curious why the sampling rate makes a difference in comparing result from a Spyder Print and iOne. Since the device is measuring a sample step one would expect that the "best" return would be an average of the entire step, or as large a circle of it as possible.Originally Posted by Richard Boutwell

Recently I compared the results of linearizing a 51 step wedge with the iOne and a densitometer. When I compared the .quad file I noticed that the individual ink curves that resulted from linearizing the profile with the densitometer, which measures a circle of about 1/4" in diameter, were much smoother than the curves produced by scanning with the iOne.
In my case I assumed that the difference was due to small uneveneness in density within each step that result from hand coating and hand sensitizing with my carbon transfer process. But that in turn got me to thinking about how the various devices actually return readings for a single step from the step wedge. I know that the return from the densitometer is an average of the 1/4" aperture, but am not sure how this is computed by the iOne or Spyder Print.
Sandy
For discussion and information about carbon transfer please visit the carbon group at groups.io
[url]https://groups.io/g/carbon
I can not say for certain, but I think the small variations in measurement angle from pressing the button on the spyderprint and single patch measurements is what is causing the dramatic sample to sample differences. I don't have much experience with different densitometers, but the x-rite i have is super solid and the measurement angle does not change at all.
There are a few questions I have been chewing on for a while. Most Density measurements are not as precise as L* measurements but L* might show more errors. So, you would think there would be a benefit of measuring in Density because the errors basically get rounded off. The problem is that any precision gets rounded off too... So is it better to average off the errors in the L* measurements by simply routing off, or averaging several passes of from an i1, or the simple moving mean error correction the piezoDN/peizoPro system uses?
Then there is also the issue of the quality of the measurement device and how it records and transmits the signal back to the software. Not being an electrical engineer I can really only make assumptions, but higher quality devices might have better voltage stabilization in the unit to provide more consistent illumination and recording of each sample (and that is where more samples per patch in scan mode would conceivably be better than the single spyderprint measurements). Unless you are using a voltage stabilizer and an automated chart reader like the dtp-41 or 70 most handheld devices get power over USB, and there might be slight fluctuations that cause the errors from one patch to the next.
The other main issue with the resulting quad curves is that when you are linearizing with the QTR tools the Density measurements are translated to xyz_y then to Lab_L*. You might see more bumps in the linearizing from the original L* values but not in the quad curves from original Density measurements because the errors are rounded off to 2 decimal places before being converted to xyz_y to L*. Basically the number of decimal places in the Density measurements might not show the errors in the precision of the L* measurements. The issue is balancing precision with the degree of error and deciding if/how to smooth the errors...
I had the same issue when I was building my pre-piezoDN linearizer earlier in the year. At first I thought my correction curve math was bad because I had regular bumps in the resulting measurement file (but not in the gradient) but It turned out to be inconsistent coating between the top of the chart and the bottom (The simple moving average was enough to solve that, and it was interesting to see that is what Walker had done with the CGATS smoother tool also). This data smoothing thing wasn't a problem with my inkjet print linearizer, where I was just using averages from 3 51-step targets from the i1. However, when linearizing from a larger patch chart, like those with 129-256 patches, it does require some data smoothing no matter how good the measurement device or the number of samples per patch. That might be caused by variations in the paper surface, slight changes in the measurement angle, drying time, temperature, humidity, tidal forces...
Personal Site http://www.richardboutwell.com
Black and White Aesthetics, Editing, and Printing http://www.BWMastery.com
Measuring a sample with my Spyder spectro - without moving the sensor at all - I get the same Density reading every time. Switching to Lab, I get a different reading every time. I complained to the manufacturer about it and they told me it was normal. Whether its voltage instability or some other factor, I figured it's an inferior device.
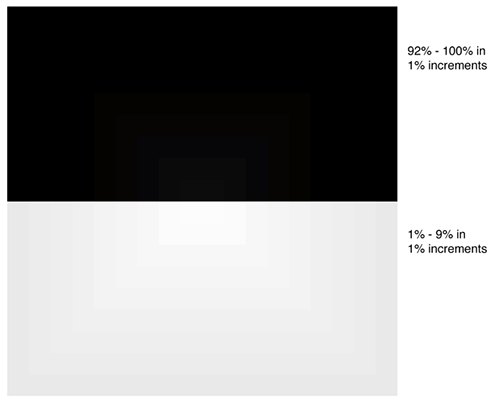
Whatever the instrument, I realized that sampling only 21 steps is inadequate for fine art printing, being just over 4-bit precision. Below is a section from the piezography target "proofofpiezography.tif". It contains sections from the low and high end of the tonal scale in 1% increments. My calibrated iMac can barely separate the high values, and completely blocks the low value. However, my piezography prints clearly distinguish each step. 100 steps is less than 7-bit precision, still shy of 8-bit and far below 16-bit precision. My piezography prints distinguish all 255 steps, giving real 8-bit precision.
For me, now the problem is that the Piezography system has raised the bar of tonal fidelity to the point where I need to consider getting a real monitor like an NEC Spectraview or Eizo which can see the entire tonal scale. Simple monitor profiling software doesn't get us there, particularly at the low end of the tonal scale. See The K7 standard and monitor display systems, written all the way back in 2008. Perhaps if we consider the paper wasted in making too many proofs, such a monitor will pay for itself.
At Cone Editions and InkjetMall we have a unique algorithm for fixing inherent measurement errors in spectrophotometers that is not an average of multiple readings or a line-average of an array of different readings on a scale. We have updated this algorithm and it will be available for single-seat use within a tool called the "Piezography Error Corrector" as part of the Piezography Professional Edition toolset for 51 and 129 step targets. We'll be launching in 45 days or so. info at our newly re-vamped website http://piezography.com
best,
Walker
------------------
Walker Blackwell
 Posting Permissions

 Reply With Quote
Bookmarks